
After the video codecs were investigated, some results were produced which are shown here. The Quality was measured by means of a Mean-Opinion-Score but the Storage, Data-Rate and Compression Time were measured by a computer analysis.Basically, the original video footage was compressed several times using the various codecs of interest and then the results observed to realise the advantages and disadvantages of each.


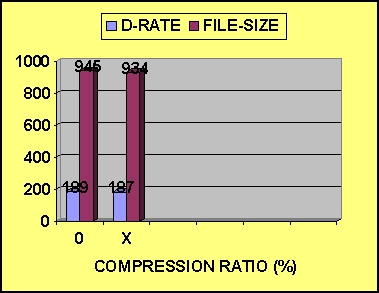
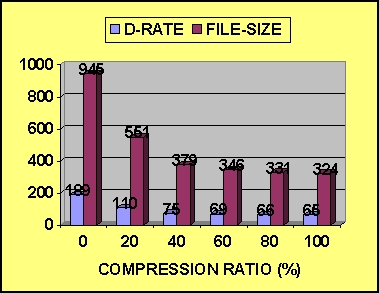
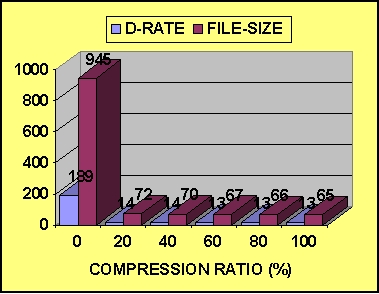
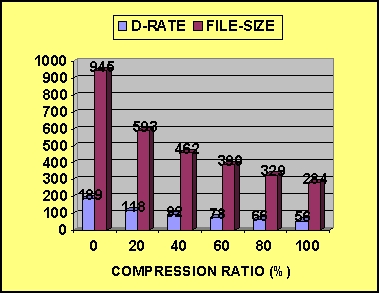
The following bar charts show how the Data-rate and Storage
Requirements vary with increased Compression: (PLEASE
NOTE: The File-Size is in (Kbytes) and the Data-Rate is in (KBytes/Sec))
(Samples compressed using PII-400MMX computer)


The MPEG-4 compressor used in this analysis is
actually a H.263 standard codec and is a subset of the actual MPEG-4 that is out now.


Another more important measure is the Quality
since it shows how good or bad the visuals are, of the video being viewed. The quality
varies as the compression ratio is increased and varies in different ways according to
which

codec is used since each codec has its own
ability or unique properties. Due to not having the means to measure the quality by a
computer analysis etc, the video is rated by using the following key by a
Mean-Opinion-Score which is

(5) - VERY GOOD, (4) -
GOOD, (3) - FAIR, (2) - POOR, (1) - VERY POOR
an approximate but fair type of method. A group of 20 volunteers, who have a good knowledge of what quality is, are shown the video and then each one rates the quality using the key mentioned above. The mean value is then calculated and the quality approximated to see which codec performed the best and which performed the worst.
The volunteers are given reference quality
samples which indicate what is VERY GOOD quality and what is VERY POOR, in order for them
to make a decision whether the sample that they are observing is closer to the best sample
or the worst. The following video samples, previously used, are used here as reference
points:
ORIGINAL VIDEO FILE

This is the original video file and
shows VERY GOOD quality.
INTEL INDEO R3.2 - (Video Information 100%)

This is a video file by Intel Indeo
R3.2 and shows VERY POOR quality.
The volunteers had the option to rate the video as either (4)-Good,
(3)-Fair or (2)-Poor since the best video is obviously the Original and the worst is the
Intel Indeo R3.2 compressed at 100%, shown above.
The end results can be seen below in a bar chart form:
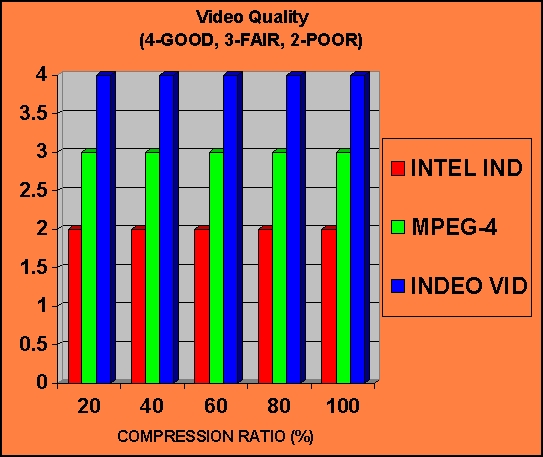
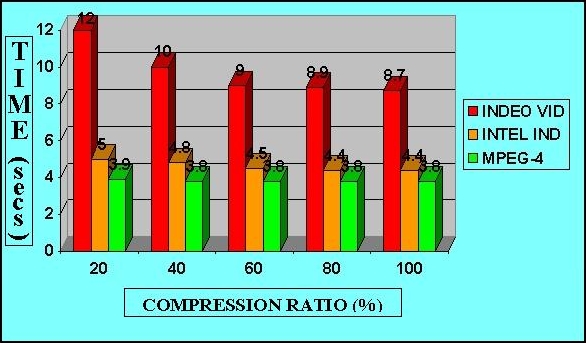
Obviously, the Indeo Video 5.06 codec seems to have performed best in terms of quality which uses Wavelet Technology for compression. Now that quality has been looked at, the next measure is Compression Time which

shows how long each of the individual codecs took to compress the
original video at the various compression ratios.
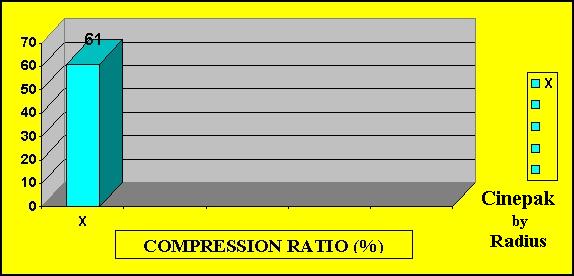
The 'Cinepak Codec by Radius' is plotted on a chart separately because it takes the
longest time and therefore stretches the y-axis to 61 secs therefore the other time values
of the remaining codecs (which have a maximum time of 12 secs) would not be seen very
clearly.
VIDEO CODECS (Summary)
After investigating the storage, data-rate, compression time
and quality issues related to the various video samples used, some points are noted which
classify each individual codec in terms of their unique capabilities, in other words, what
each codec is good at.
The points noted are as follows:
1. Cinepak Codec by Radius
(uses
Vector Quantisation and Frame Differencing)
2. Intel Indeo R3.2
(uses
Vector Quantisation only)
3. Mpeg-4 (High Speed Compressor)
(uses Block
Discrete Cosine Transform and Motion Compensation)
4. Indeo Video 5.06
(uses
Wavelet Compression)
The advantages and disadvantages have become
quite clear now. Nevertheless, bearing in mind that a fast processor was used for the
compression, the compression times are still too high when compared to the new wavelet
method results by Summus Technologies, mentioned in the 'New Research
and Technologies' section.
![]()
Copyright 1999 by Irfan
Rashid. All Rights Reserved.